
This is an article I wrote for the first iteration of my newsletter. Here I have done some calculations on stock data from the S&P 500. In short, I calculated the Sharpe Ratio for 500 shares and had a quick look, this is what I found. (Also, there is a nice tutorial if you want to have a go using Excel [link])
Of the top 20 shares with the highest Sharpe ratios, 9 companies were from the energy sector which isn’t surprising due to the ongoing concerns and media coverage around the energy crisis. The FT reported that they expect the energy crisis to go on for several years [link] with the IEA stating that the crisis is caused by disruptions to the supply chain, weather, low investment, and Russia’s invasion of Ukraine [link].
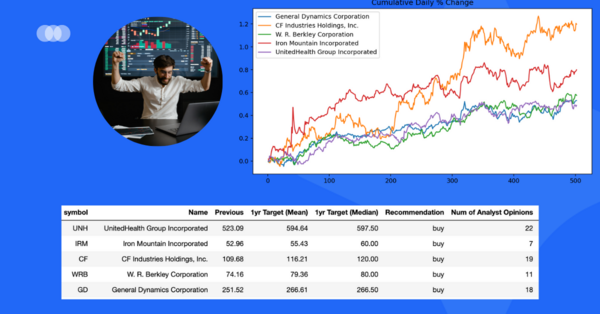
When looking at companies with the highest Sharpe ratio which are not in the energy sector we can filter the data to show high Sharpe ratios and also high ‘1-year targets’ (based on analyst data from Yahoo Finance).
As shown in the image, UnitedHealth Group Incorporated is expected to increase from $523 to around $590 (+14%) based on 22 analysts. Iron Mountain Incorporated is expected to increase from $52 to between $55 and $60 (up to +13%). Analysts are showing these stocks as ‘buy’ along with also CF Industries Holdings, Inc., W. R. Berkley Corporation, and General Dynamics Corporation. All of these shares had high Sharpe ratios.
Remember – this is not financial advice – just a data scientist who looked at some data.